Connectitude OEE has the market’s highest data granularity, transforming analyses into concrete actions. With tailored features designed for operators, it becomes easier than ever to quickly get started with streamlining your production.
Visualize
Monitor your production in real-time. Clear and simple diagrams display the status of your process.
Analyze
Quickly understand causes. Identify trends and issues without complications.
Change
Collaborate for change. Utilize insights to prevent losses.


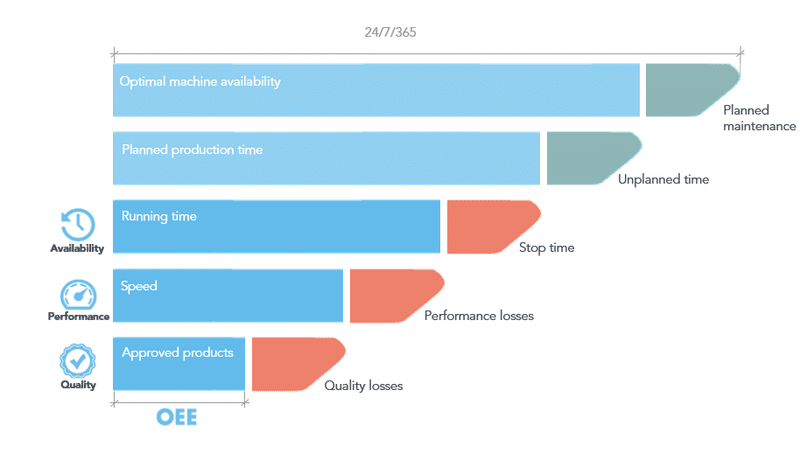
OEE (Overall Equipment Effectiveness) is a key metric that measures the efficiency of production and identifies losses.
With Connectitude OEE, this process is simplified, providing continuous insights for improving your production efficiency.
Learn more about why you should measure OEE with Connectitude OEE!
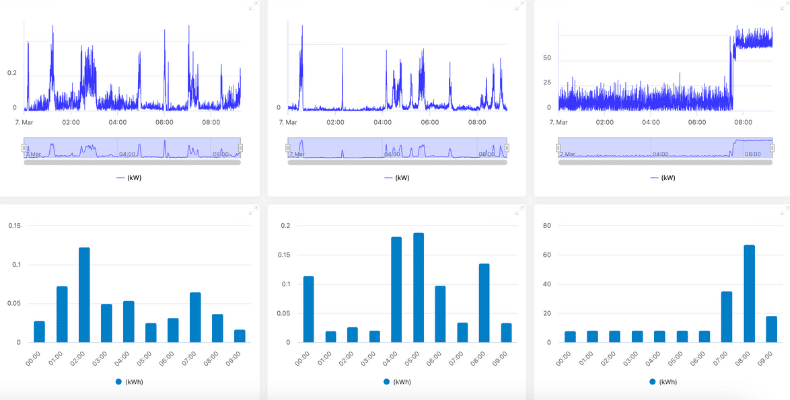
Connectitude OEE offers the market’s most detailed data resolution. This means that no problems are too small to be detected!
Overviews and analyses of detailed data provide opportunities for analysis and problem-solving that other systems lack.
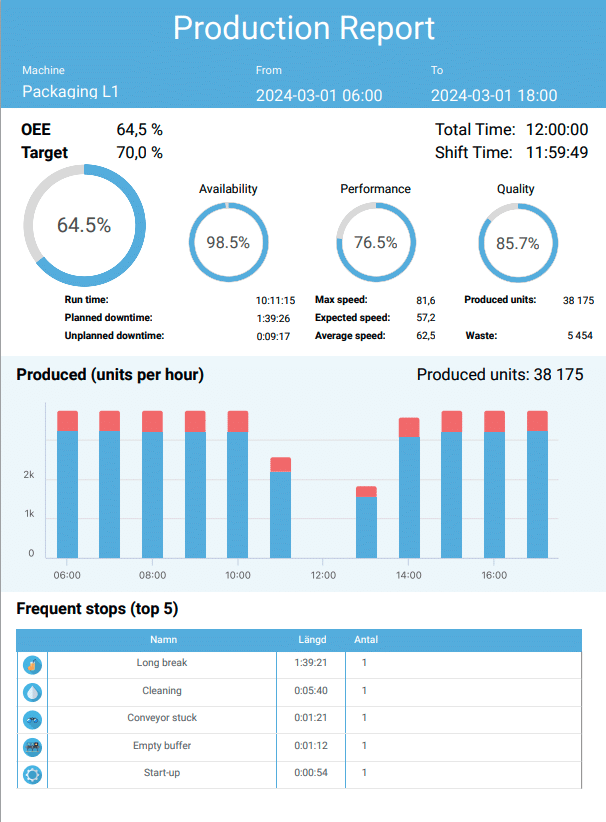
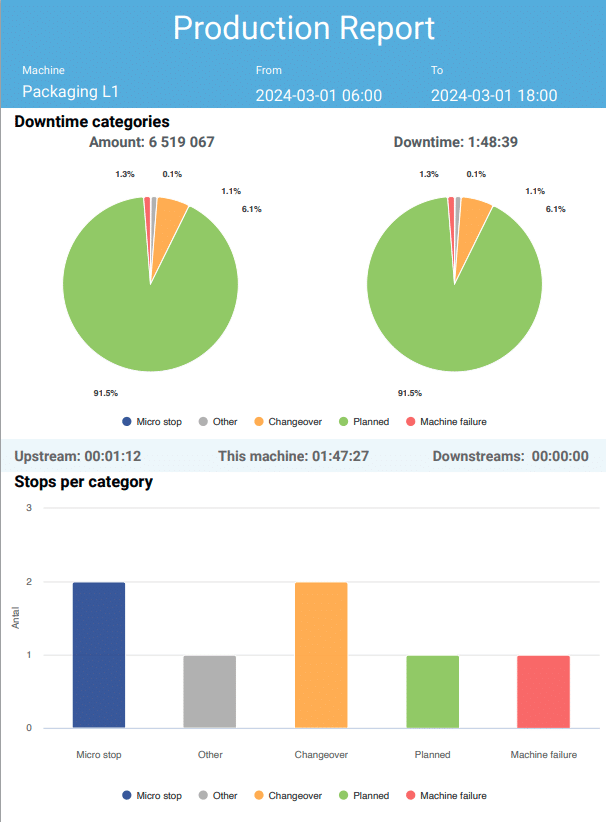
Pre-made automated reports ensure that the right information reaches everyone on time. Weekly summaries or shift-specific reports are delivered directly to your inbox, ready to be used to improve your production.
The simplicity of reports also means that you can share and communicate data between departments and factories, laying the groundwork for a culture of improvement.
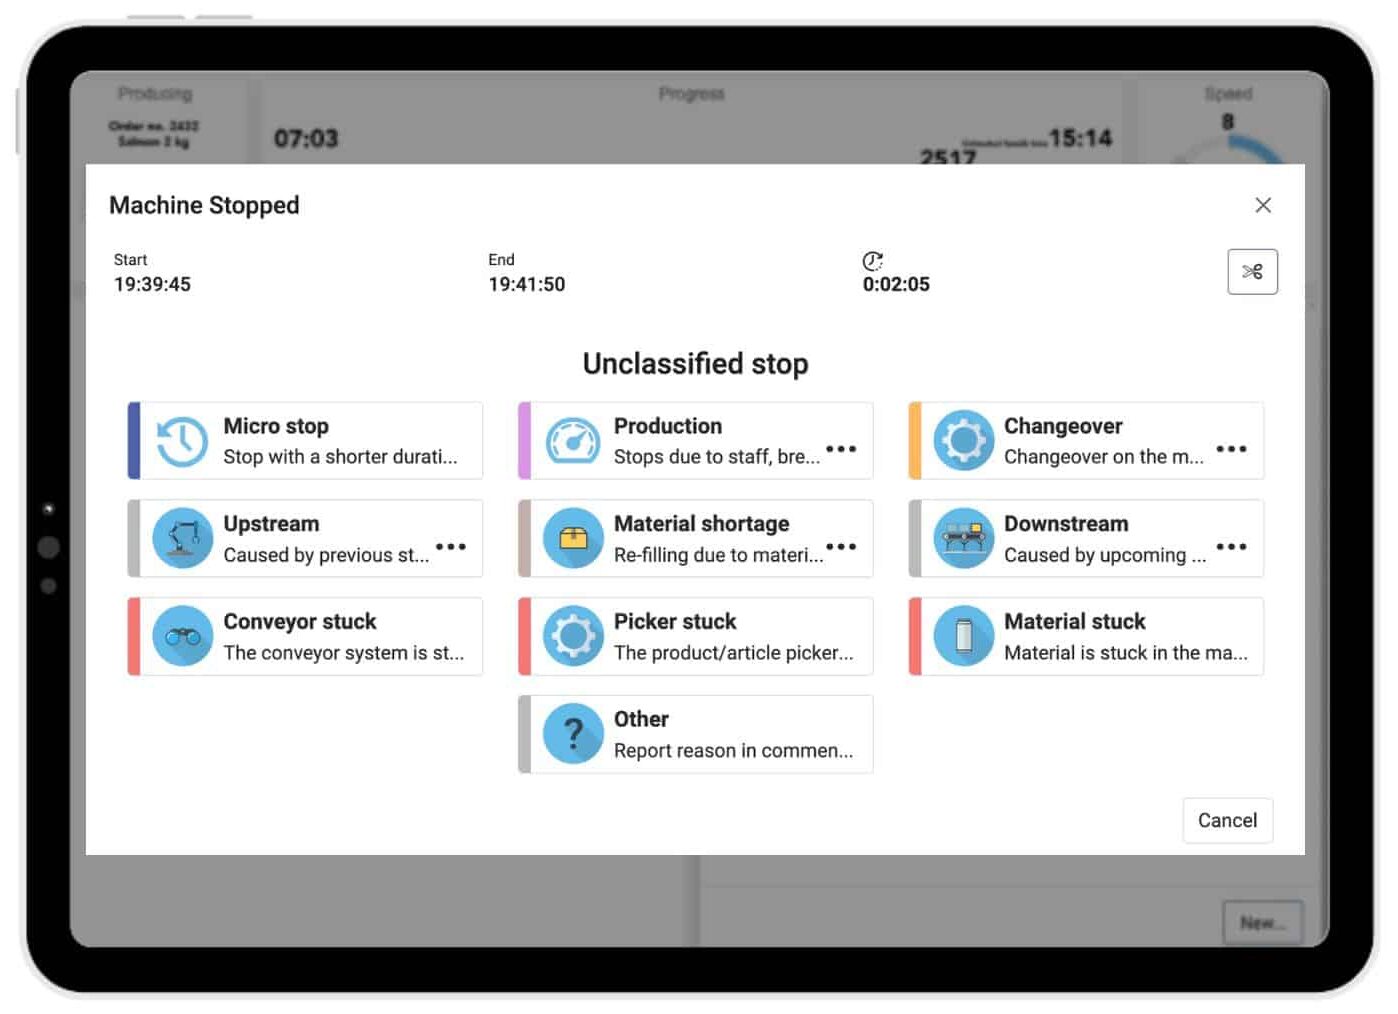
It’s critical that operators quickly and easily are able to report causes for downtime. With our extensive industry experience, we have created a user-friendly registration view for those working under demanding conditions.
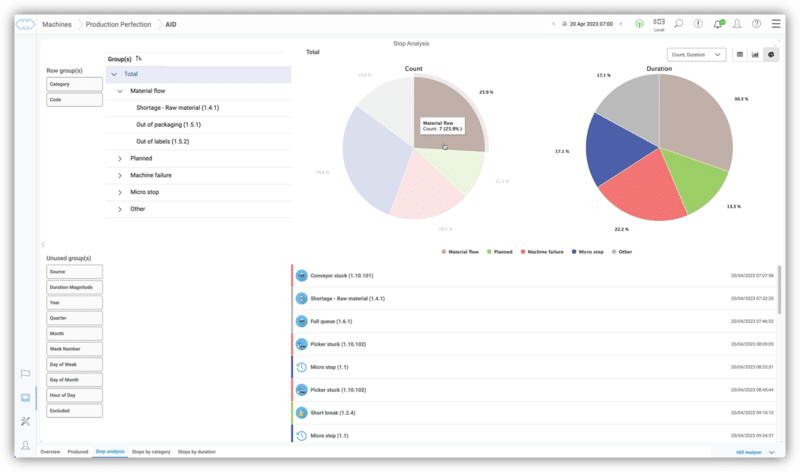
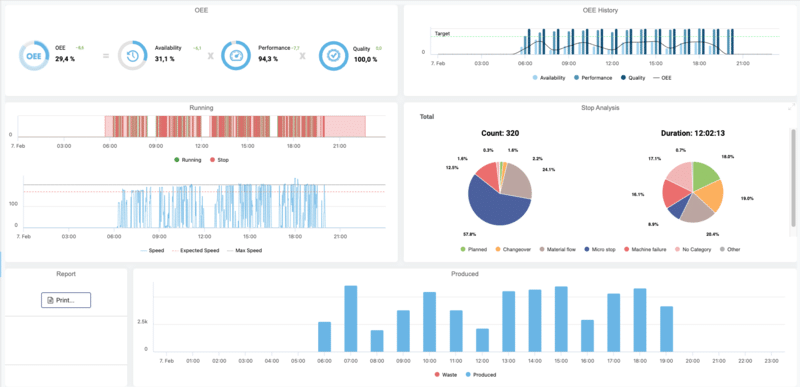
In our stop analyses, you can easily see when stops are most common and what causes them. Dive into the data, and bring forward insights that can make your production even more efficient.
If you make any changes or more data comes in, the analysis updates in real-time!
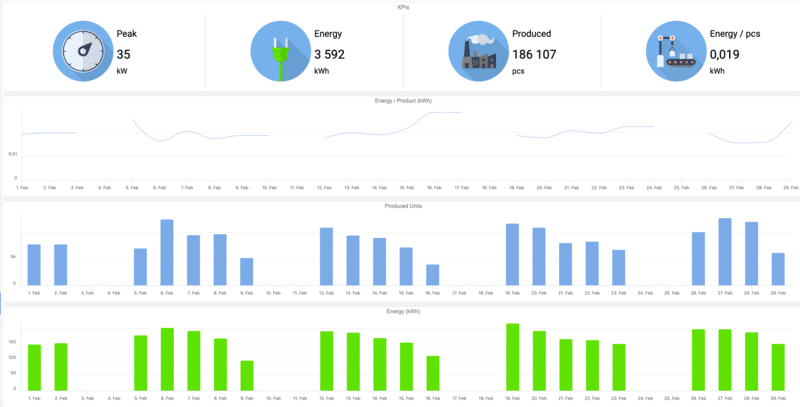
With Connectitude OEE, in addition to production rates and stops, you can also collect additional parameters from your process.
With our built-in analysis tools, you don’t need to export data to any external system to find correlations that help you understand how to address issues in your production. Moreover, the analysis updates in real-time!
Make it easy to collaborate effectively and share insights from your production. Let each role have optimal tools to perform their tasks and routines.
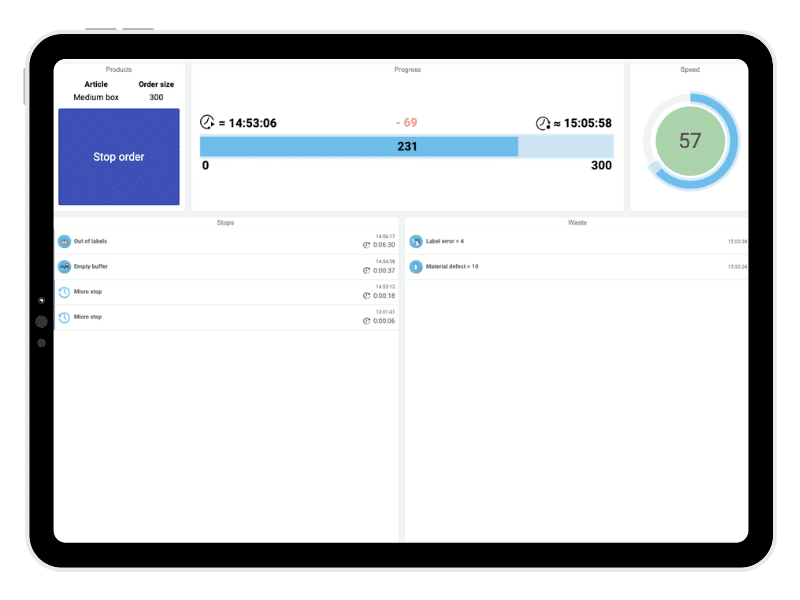
With Connectitude OEE, the operator gets an interface where it’s easy to keep track of what needs to be done, how it’s going, and reporting on why production has stopped is quick.
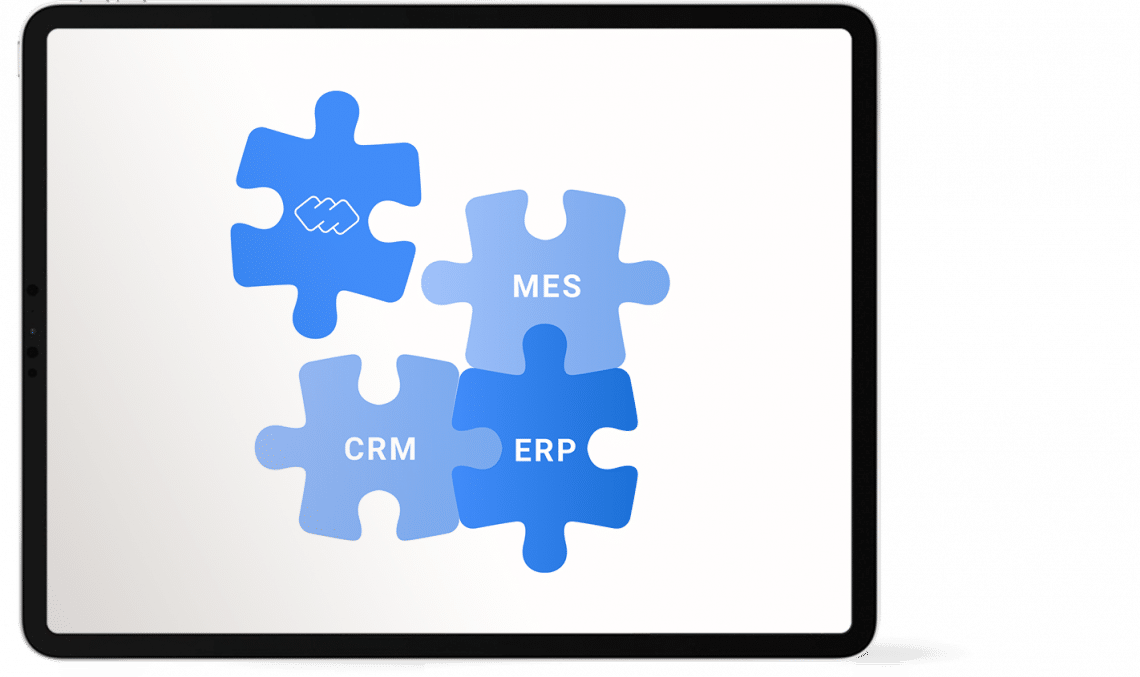
With our efficient integrations, you avoid having to access other systems that disrupt the workflow and process.
Within an hour, you’ll have new insights from your production! The system is ready to use without any software installation, and we handle all potential sensor installations on-site for you.
With our role-based user system, you can easily invite an unlimited number of users to access the information they need.

We use cookies to make the website work in a good way for you.
By continuing to browse, you agree to that we use cookies. What are cookies?