

DIVE DEEP INTO DATA WITH INTEGRATED BUSINESS INTELLIGENCE
Understanding and resolving production issues can be complex. This is where Connectitude OEE’s Integrated Business Intelligence (BI) comes into play. Our system not only gathers crucial production data such as throughput and downtime but also allows you to capture and analyze additional parameters essential to your processes.
You don’t need to be a data expert to explore and understand complex relationships in production data with Connectitude OEE. Our built-in BI tools provide instant insights directly within the user interface, eliminating the hassle of exporting to external systems. This means you can identify, understand, and address even the most challenging problems.
REAL-TIME ANALYSIS FOR QUICK RESPONSE
Since Connectitude OEE updates the analysis in real-time, you can see how new information affects it immediately as it is collected. This rapid feedback loop ensures that you draw accurate conclusions and also creates an understanding of the adjustments and improvements that make a real difference. Simply put, it’s a tool that keeps your production at its best, minimizing interruptions and optimizing performance.
ANALYSIS POSSIBILITIES
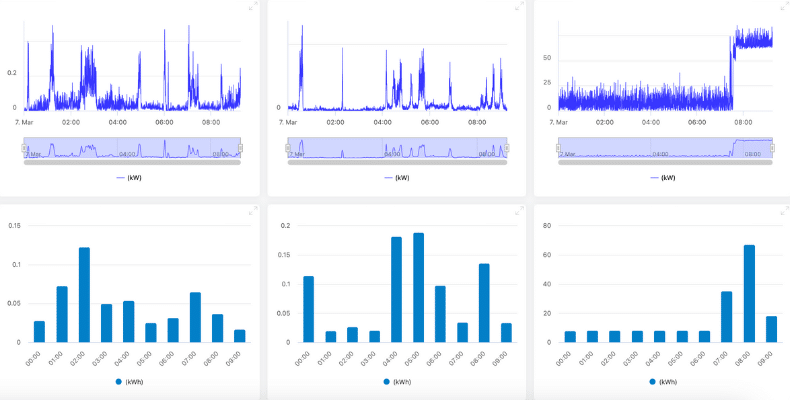
Quick overview graphs: With Connectitude Compare, you can quickly create graphs to compare your production units. This makes it easy to identify areas where improvements can be made.
Comparison for improvement: Analyze how different machines and teams perform against each other. By comparing your resources and results over time, you get a solid foundation for future planning and forecasting.
Profitability analysis: Review the profitability of different products and series. This insight helps you make informed decisions for the company’s finances.
Flexible and powerful: Combine and save selections for different comparisons. Choose parameters from interactive lists and display trends in simple graphs.
Right information to the right person: Customize presentations and graphics according to different roles and tasks. Create a positive competitive atmosphere in production and provide specialists with the detailed information they need.
Plan with real data: What does historical data show about quality shifts during the summer months? How are lead times and downtime expected to affect new products? Use data to plan smarter.