

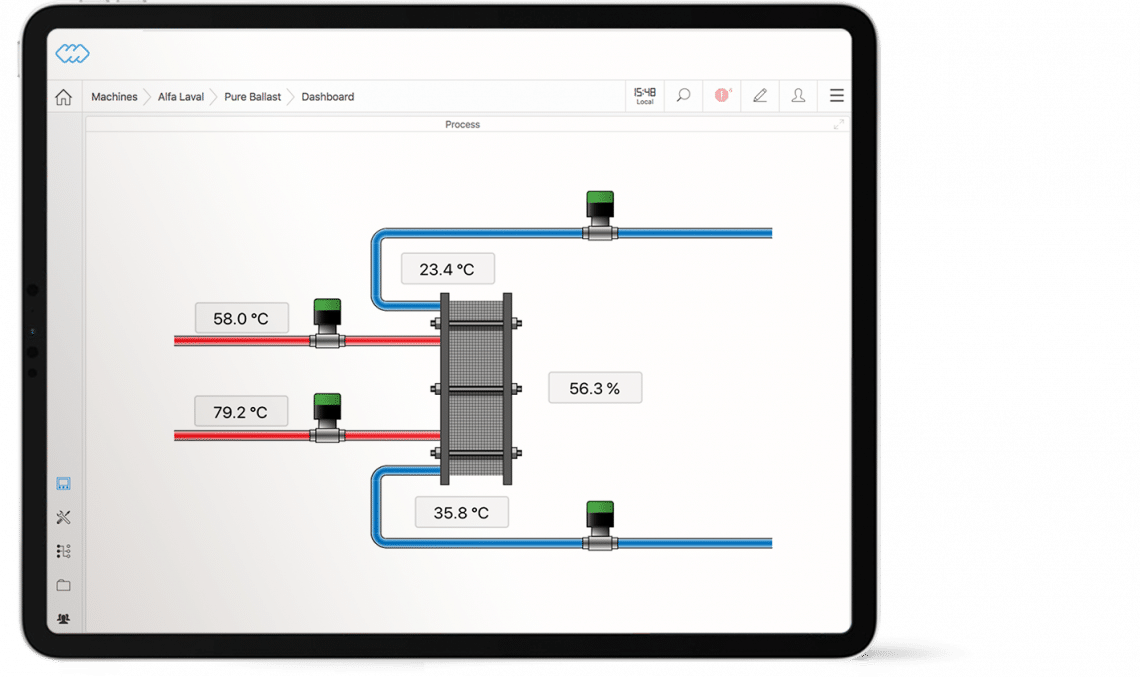
The Process view designer is a very versatile tool to create graphical presentation of data. It can be used to illustrate schematics of your processes as well as visually share KPIs and live data.
Easy to use
Upload design items as illustrations, animations etc. to the media library in various file formats. Drag, drop and combine with your real time values and historical trends.
Trigger visual alerts
Add triggers as alarms and logial expressions to your values and graphical objects. Highlight parameters with changes of colours, visual effects and symbols for various conditions.
Effective online reporting
You will have various tools for creating dashboards designed for sharing vital information. Use pie charts and historical trends for graphical presentation of KPIs.