

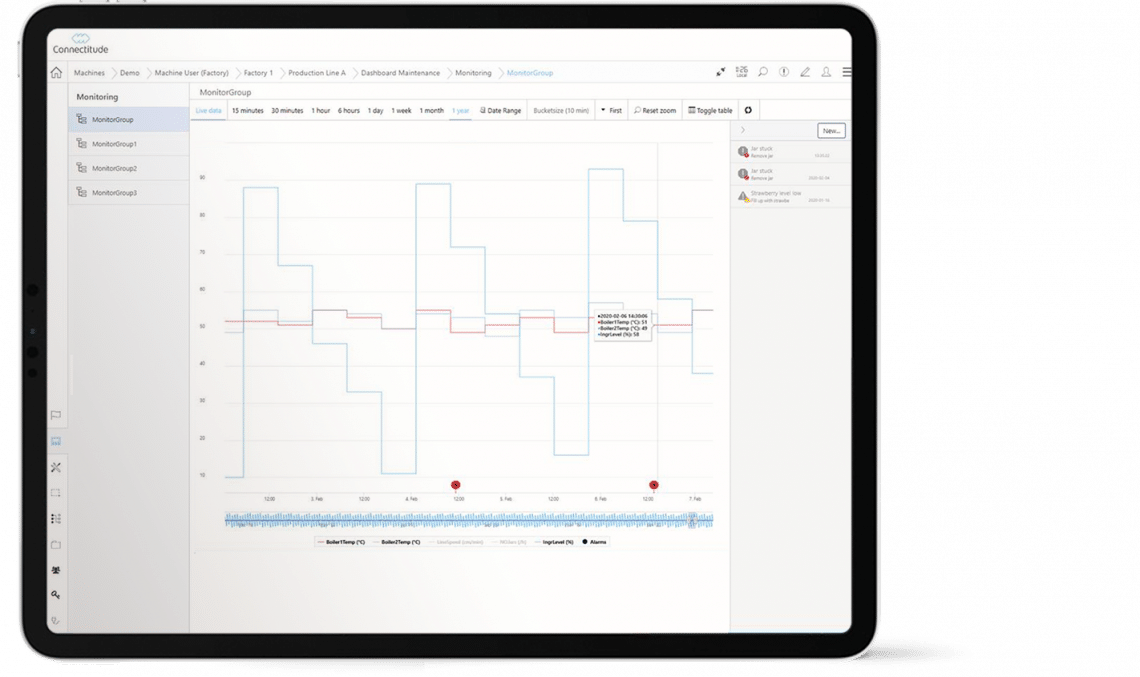
With Trends you can quickly do visual analyzes of trends and patterns for anomalies. Ideal for comparisons of objects for optimization.
Easy to use
Select relevant parameters to a monitor group from a drop down list. Able or disable chosen parameters in your graph for an autoscaled view with zoom functions.
Faster troubleshooting
Add alarm code and events to the timeline. A quick glance on the graph can expose the triggers or give a hint on what to investigate further.
Dare to compare
Side-by-side comparisons of graphs for machines, buildings, work teams and more helps to disclose parameters causing variations in performance.