

Connectitude Compare makes visual benchmarking easy. Create graphs for quick comparisons of your various production units. Compare data between different time periods for an individual production unit.
FLEXIBLE AND POWERFUL
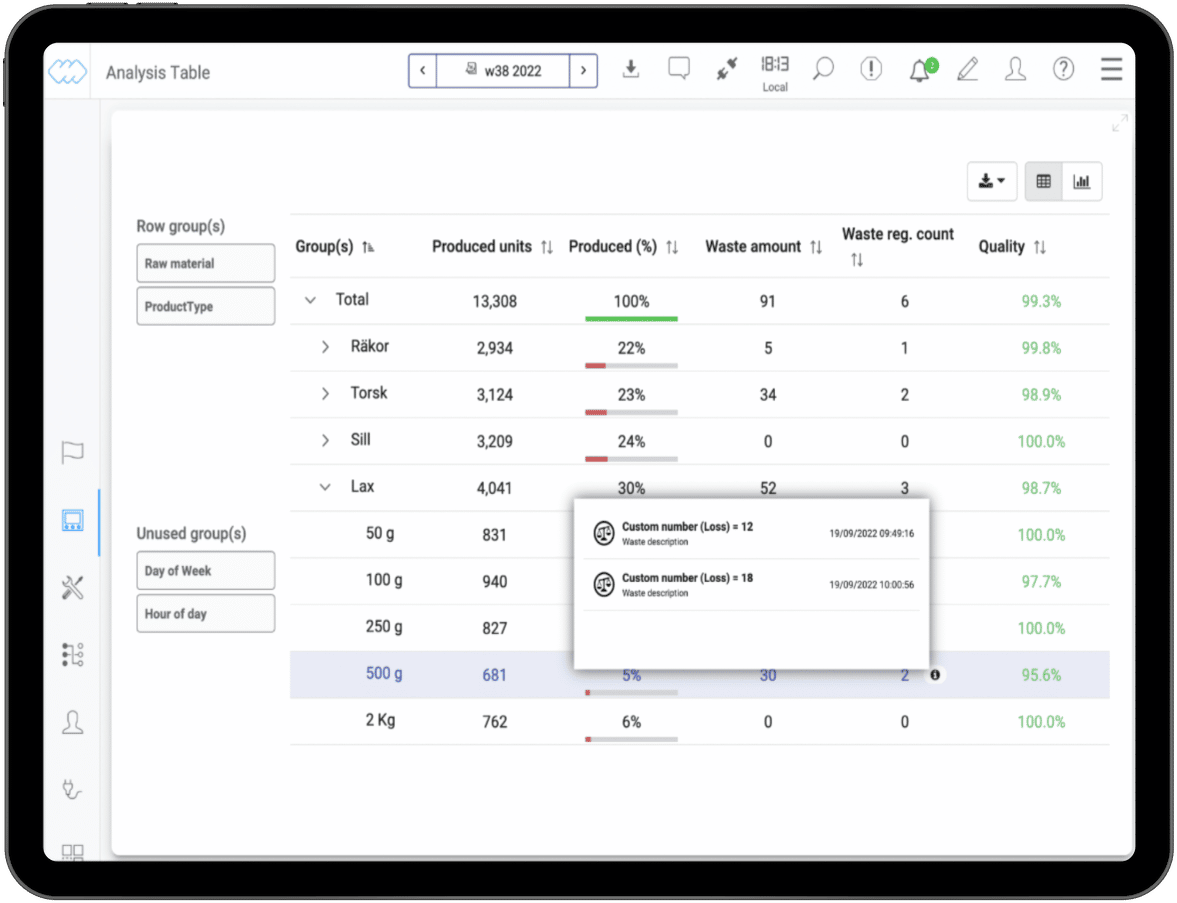
Combine and save selections of different comparison objects. Select which parameters you want to examine from interactive lists. Present the trends in intuitive graphs.
COMPARE AT THE RIGHT LEVEL
Present information and graphics optimized for roles and tasks. Create a competitive spirit in the production and give the specialists the details needed for their analyzes.
PLAN WITH FACTS
How does the quality change during June to August? What should we expect for lead time and downtime for new items? Compare historical data from different perspectives for smarter planning.